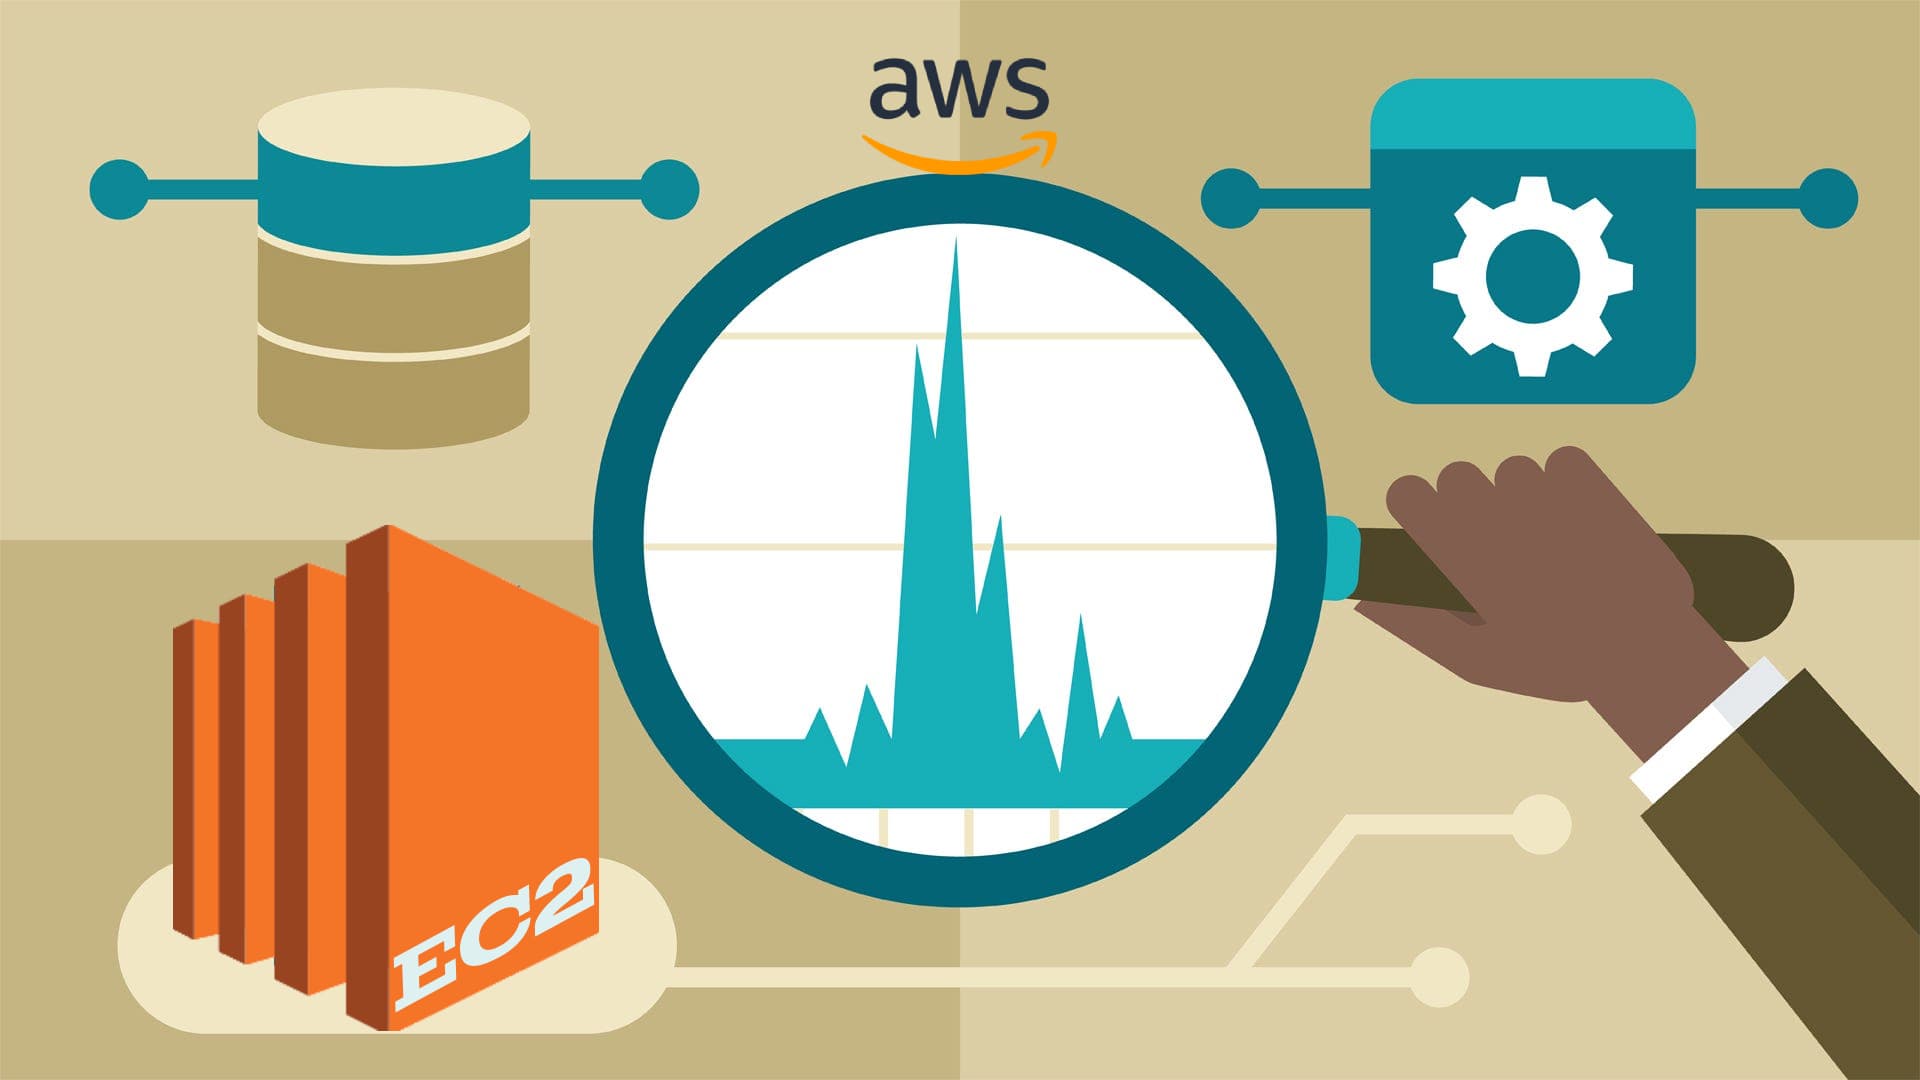
How can we Monitor an EC2 Instance?
I'm AWS Certified Solution Architect. I do write about the AWS Cloud Operation, Migration, Security and Automations.
In this Demonstration we will set up an instance on Amazon Elastic Compute Cloud and create a Amazon CloudWatch alarm which will be triggered, when the CPU utilization of the EC2 instance exceeds a threshold and set up a subscription using Amazon Simple Notification Service (SNS) to receive email notifications.
Logging and monitoring are techniques used to achieve goals. They work together to ensure that system performance meets baselines and security guidelines consistently.
Amazon SNS is a managed messaging service that enables communication.
CloudWatch is a monitoring and observability service. It provides data and insights for monitoring applications responding to performance changes across systems and optimizing resource utilization. CloudWatch collects logs, metrics and events as part of its monitoring data collection process. By using CloudWatch you can have a view of your health and gain visibility into your AWS resources, applications and services running both on AWS and, on premises.
Objectives:
After completing this Demonstration, you will be able to:
Create an Amazon EC2 instance
Create an Amazon SNS notification
Configure a CloudWatch alarm
Stress test an EC2 instance
Confirm that an Amazon SNS email was sent
Create a CloudWatch dashboard
Let's begin the Demonstration:
TASK 1:Create an Amazon EC2 Instance.
Step 1: Go to the management console and Search for Ec2 and click on it.

Step 2: Give a Name to the instance. for now, we name it "Stress Test".

- choose an Amazon Machine Image for now we choose Amazon Linux 2 AMI (HVM). Recommend you choose (Free tier eligible)

Step 3: For the key pair(login) we proceed without a key pair. You could choose an existing or create new key pair.

Step 4: you could leave other settings default and click on Launch instance

TASK 2:Configure Amazon SNS
Step 3: Go to the management console and Search For SNS

Step 4: On the left, under Dashboard choose the Topics, and then choose Create topic.

Step 5: On the Create topic page in the Details section, configure the following options:
Type: Choose Standard.
Name: Enter the name. For now, we say "MyCwAlarm"

Step 6: Choose Create topic.

Step 7: On the MyCwAlarm details page, choose the Subscriptions tab, and then choose Create subscription.

Step 8: In the Details section, configure the following options:
Topic ARN: Leave the default option selected.
Protocol: From the dropdown list, choose Email.
Endpoint: Enter a valid email address that you have.
and Click on Create subscription.

- In the Details section, the Status should be Pending confirmation.

- You should have received an AWS Notification - Subscription Confirmation email message at the email address that you provided in the previous step.

- After you click on the Confirm subscription from the mail, In the Details section, the Status should be Confirmed.

Task 3: Create a CloudWatch alarm
Step 9: In the AWS Management Console, enter Cloudwatch in the search bar, and then choose it.

Step 10: In the left navigation pane, choose the Metrics dropdown list, and then choose All metrics.

Step 11: On the Metrics page, choose EC2, and choose Per-Instance Metrics.From this page, you can view all the metrics being logged and the specific EC2 instance for the metrics.


Step 12: Slect the check box with CPUUtilization as the Metric name for the Stress Test EC2 instance that we created.

Step 13: In the left navigation pane, choose the Alarms dropdown list, and then choose All alarms.

Step 14: Choose Create alarm.

Step 15: Choose Select metric and click on Next

Step 16: choose EC2, and then choose Per-Instance Metrics.

Step 17: Under the Search bar type CPUUtilization and hit Enter.

Step 18: Select the Stress Test and Click on Select metric.

Step 19: On the Specify metric and conditions page, configure the following options:
Metric
Metric name: Enter CPUUtilization
InstanceId: Leave the default option selected.
Statistic: Select Average
Period: From the dropdown list, choose 5minute.

Conditions
Threshold type: Choose Static.
Whenever CPUUtilization is...: Choose Greater > threshold.
than... Define the threshold value: Enter 60
and Click on Next.

Notification
Alarm state trigger: Choose In alarm.
Select an SNS topic: Choose Select an existing SNS topic.
Send a notification to...: Choose the text box, and then choose MyCwAlarm.

Name and description
Alarm name: Enter CPUUtilizationAlarm
Alarm description - optional: Enter CloudWatch alarm for Stress Test EC2 instance CPUUtilization
After that Choose Next.

Step 20: Review the Preview and create page, and then choose Create alarm.

Task 4: Test the Cloudwatch alarm
Step 21: In the management Console search for EC2 and click on it.

Step 22: Now, under the Instances Click on the Stress Test Instance that we created earlier and Click on Connect on the right side of Instances,

Step 23: From the Connect to instance Choose Session Manager and Click on Connect.
(Note: you can connect from EC2 Instance Connect as the ultimate goal is to increase the Cpu utilization so that we get notified from the Amazon SNS through mail.)

Step 24: To manually increase the CPU load of the EC2 instance, run the following command:
sudo stress --cpu 10 -v --timeout 200s
- the output from the command should look similar to the following.

Step 25: Navigate back to the AWS console where you have the CloudWatch Alarms page open. Then Choose CPUUtilizationAlarm after that Monitor the graph while selecting the refresh button every 1 minute until the alarm status is In alarm.
On the graph, you can see where CPUUtilization has increased above the 60 percent threshold.

Step 26: Go to your email inbox for the email address that you used to configure the Amazon SNS subscription. You should see a new email notification from AWS Notifications like this below.

Task 5: Create a CloudWatch dashboard
Step 27: Go to the CloudWatch in the AWS console and In the left navigation plane, choose Dashboards and Click on Create dashboard.

Step 28: Give a name to the Dashboard for now we say it EC2Dashboard and click on Create dashboard.

Step 29: Under Add widget choose Line and click on Next.

- Choose Metrics and click on Next.

Step 30: Now, Choose EC2 and then Per-instance Metrics.


Step 31: Under the search bar type CPUUtilization and select the Stress Test, and Click on Create widget.

Step 32: Finally, you can see the CPUUtilization of an Instance.

Congratulations!!!
You now have successfully:
Created an Amazon SNS notification
Configured a Cloudwatch alarm
Stress-tested an EC2 instance
Confirmed that an Amazon SNS email was sent.
created a CloudWatch dashboard
