EBS Volume Monitoring through CloudWatchAgent and Setting an Alarm
I'm AWS Certified Solution Architect. I do write about the AWS Cloud Operation, Migration, Security and Automations.
Introduction:
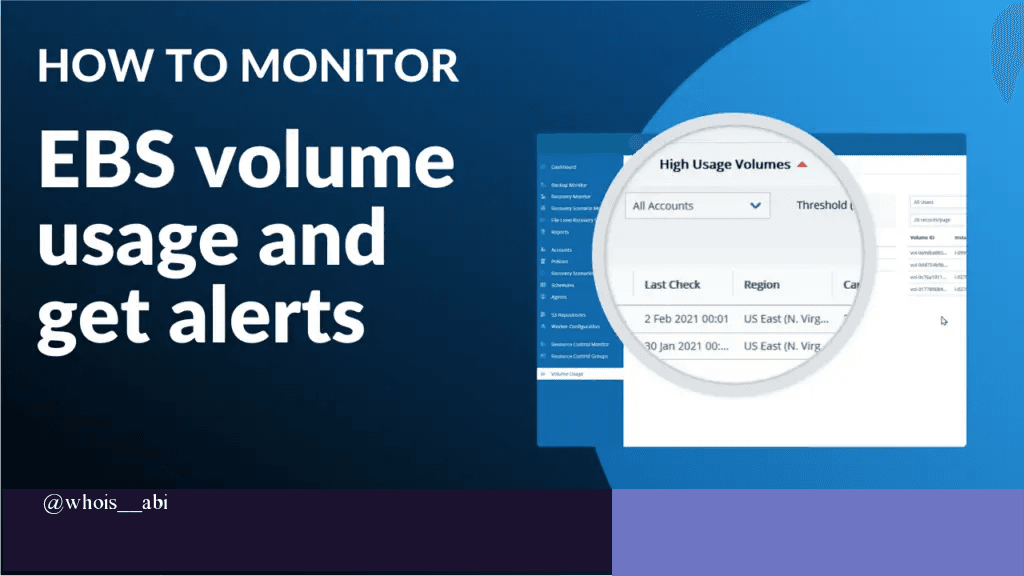
Monitoring storage utilization is critical to ensure application stability and avoid unexpected outages. In AWS, Amazon EBS does not provide built-in metrics for volume-level disk usage, which makes proactive alerting a challenge. To address this, we can install a CloudWatch agent that publishes custom disk utilization metrics to Amazon CloudWatch, enabling us to configure alarms and receive email notifications when EBS usage reaches critical thresholds. In this blog we will setup an alarm if our EBS Volume usage is 80% and above.
Architecture Diagram:

Procedure:
Step 1: Launch the EC2-Instance

Step 2: Copy the Public-IP address of the Instance.

Step 3: Connect the server using ssh key
ssh -i /path/<Keyfile.pem> ec2-user@<public Ip>
#example:
ssh -i max-demo-key.pem ec2-user@18.207.190.7

Step 4: Install and configure the cloudwatch agent
you can do it manually or configure with with a custom script.
- make a script install.sh and place the following code.
#!/bin/bash

# Update package list
echo "Updating system packages..."
sudo yum update -y || sudo apt-get update -y

# Install CloudWatch Agent
echo "Installing Amazon CloudWatch Agent..."
sudo yum install -y amazon-cloudwatch-agent || sudo apt-get install -y amazon-cloudwatch-agent

# Create CloudWatch Agent Configuration
echo "Creating CloudWatch Agent Configuration for EBS volume monitoring..."
CONFIG_FILE="/opt/aws/amazon-cloudwatch-agent/etc/amazon-cloudwatch-agent.json"

sudo tee $CONFIG_FILE > /dev/null <<EOF
{
    "agent": {
        "metrics_collection_interval": 60,
        "run_as_user": "root"
    },
    "metrics": {
        "metrics_collected": {
            "cpu": {
                "measurement": [
                    "cpu_usage_idle",
                    "cpu_usage_iowait",
                    "cpu_usage_user",
                    "cpu_usage_system"
                ],
                "metrics_collection_interval": 60,
                "totalcpu": false
            },
            "disk": {
                "measurement": [
                    "used_percent",
                    "inodes_free"
                ],
                "metrics_collection_interval": 60,
                "resources": [
                    "*"
                ]
            },
            "diskio": {
                "measurement": [
                    "io_time",
                    "write_bytes",
                    "read_bytes",
                    "writes",
                    "reads"
                ],
                "metrics_collection_interval": 60,
                "resources": [
                    "*"
                ]
            },
            "mem": {
                "measurement": [
                    "mem_used_percent"
                ],
                "metrics_collection_interval": 60
            },
            "netstat": {
                "measurement": [
                    "tcp_established",
                    "tcp_time_wait"
                ],
                "metrics_collection_interval": 60
            },
            "swap": {
                "measurement": [
                    "swap_used_percent"
                ],
                "metrics_collection_interval": 60
            },
            "custom_metrics": {
                "measurement": [
                    "CustomMetricExample"
                ],
                "metrics_collection_interval": 60,
                "resources": [
                    "*"
                ],
                "default": {
                    "CustomMetricExample": 3
                }
            }
        }
    }
}

EOF
Step 5: make the script executable and run the script
chmod +x install.sh
./install.sh
Step 6: Enable and Start CloudWatch Agent
sudo systemctl enable amazon-cloudwatch-agent
sudo systemctl start amazon-cloudwatch-agent
#verify the agent is running, if required restart the agent
sudo systemctl status amazon-cloudwatch-agent --no-pager
Step 7: Create a role for agent to put metric about the resources :
- Search for IAM > Select Policy > Create Policy
CloudWatchAgentPolicy
{
    "Version": "2012-10-17",
    "Statement": [
        {
            "Effect": "Allow",
            "Action": [
                "cloudwatch:PutMetricData",
                "cloudwatch:DescribeAlarms",
                "cloudwatch:GetDashboard",
                "cloudwatch:ListMetrics",
                "cloudwatch:ListDashboards",
                "cloudwatch:PutMetricAlarm",
                "logs:PutLogEvents",
                "logs:CreateLogGroup",
                "logs:CreateLogStream",
                "logs:DescribeLogStreams",
                "logs:DescribeLogGroups",
                "logs:PutRetentionPolicy"
            ],
            "Resource": "*"
        },
        {
            "Effect": "Allow",
            "Action": [
                "ec2:DescribeInstances",
                "ec2:DescribeTags",
                "ec2:DescribeVolumes",
                "ec2:DescribeVolumeStatus",
                "ec2:DescribeInstanceStatus",
                "ec2:DescribeRegions"
            ],
            "Resource": "*"
        },
        {
            "Effect": "Allow",
            "Action": [
                "logs:DescribeLogGroups",
                "logs:DescribeLogStreams",
                "logs:PutLogEvents"
            ],
            "Resource": "*"
        }
    ]
}

Create Policy.
Now
Select Role and Create New Role
Trusted entity type to Custom trust policy

{
    "Version": "2012-10-17",
    "Statement": [
        {
            "Sid": "Statement1",
            "Effect": "Allow",
            "Principal": {
                "Service": "ec2.amazonaws.com"
            },
            "Action": "sts:AssumeRole"
        }
    ]
}
Click on Next
Select the Permission you have created Recently i.e CloudWatchAgentPolicy

Click on Next
Enter the Role Name
Click on Create Role


Step 8: Attach the Role to the Instance
On the Instances
Select the Action > choose Security > Click on Modify IAM role

- Choose the CloudWatchAgentInstanceProfile

Step 9: Restart the Agent
sudo systemctl restart amazon-cloudwatch-agent
- view the logs of the agent
sudo journalctl -u amazon-cloudwatch-agent --no-pager -n 50
sudo cat /opt/aws/amazon-cloudwatch-agent/logs/amazon-cloudwatch-agent.log
Step 10: Create a SNS Topic and make Subscription using required email address.

Click on Create Topic

Copy the Arn value
Step 11: Command to create a cloudwatch alarm.
- Change the required value also, CloudWatch metric parameter must match the dimensions.
Example: <Private_IP> and <SNS_ARN_Topic>
aws cloudwatch put-metric-alarm \
  --alarm-name "Volume 80% Utilization" \
  --metric-name "disk_used_percent" \
  --namespace "CWAgent" \
  --statistic "Average" \
  --dimensions Name=device,Value=xvda1 Name=fstype,Value=xfs Name=host,Value=ip-<Private-IP>.ec2.internal Name=path,Value=/ \
  --threshold 80 \
  --comparison-operator GreaterThanThreshold \
  --evaluation-periods 1 \
  --period 300 \
  --alarm-actions <SNS_ARN_Topic> \
  --region us-east-1
Or manually set an alarm.


Now,
Go to the CloudWatch
Select All Alarms.
Copy the ARN of the CloudWatch Alarm.

Step 12: Attach the Access policy to the SNS Topic
- CloudWatch need permission to publish the message,
Click on Edit in SNS Topic
Under Access Policy replace the policy and change <SNS ARN>
          {
            "Version": "2012-10-17",
            "Statement": [
              {
                "Effect": "Allow",
                "Principal": {
                  "Service": "cloudwatch.amazonaws.com"
                },
                "Action": "SNS:Publish",
                "Resource": "<SNS ARN>",
                "Condition": {
                  "ArnLike": {
                    "aws:SourceArn": "CLOUDWATCH ARN"
                  }
                }
              }
            ]
          }
Step 13: Restart the Agent and check the metric list.
#restart t-status
sudo systemctl restart amazon-cloudwatch-agent
#checking the metric being pushed by the CWAgent
aws cloudwatch list-metrics --namespace "CWAgent" --metric-name "disk_used_percent" --region us-east-1
Step 14: Creating Subscriptions for your SNS Topic
Go the SNS TOPIC
Create Subscriptions
Protocal: Email
EndPoint: “Enter Your Email address”

- Open your Email and Confirm Subscription

Step 15: Triggering the Event by Manually utilizing the EBS Volume.
- Creating a testfile.img with size of 5GB
sudo fallocate -l 5G /testfile.img
#view  the storage of the system
df -h

As you can see the disk utilization is 88% on /dev/xvda1 now, we should receive an alarm.

Congratulation!!!
You did a great job. you have now successfully demonstrated monitoring EBS volume using CloudWatch agent and setup an alarm when the threshold met.
Conclusion:
By publishing custom disk utilization metrics to Amazon CloudWatch, we gained visibility into EBS volume usage that wasn’t available by default. This enables timely alerts and proactive storage management, helping prevent performance issues and downtime.